- @@gbv@@@
- @@ʬRuá¤@@@
- @@Gw@@@
- @@Vläy@@@
- @@¶½ÈwÌLê@@@
- @@Letter to Students@@@
- @@VäV~@(MRIêj
The study of life is watching the“Dance of Water Molecules”.
Carlton F. Hazlewood, Ph. D.,
a great researcher of water
in living systems, told us.

| @\Xg@@i2000NÈ~j@ @@@@@@@@ |
| Koizumi M. & Kano H. (2018) Uptake and Transport of Manganese Ion in Relation to the Positions of a Root for Pea Plant Observed by Micro- magnetic Resonance Imaging.American Journal of Biology and Life Sciences 6(1), 8-13. Koizumi M. & Kano H. (2016) Water status in differently watered gelatinized rice (¿-rice), dried rice grains after boiling and steaming, observed by micro-magnetic resonance imaging. American Journal of Food Science and Nutrition Research 3(6), 154-161. Koizumi M. & Kano H. (2016) Water entry for the black locust (Robinia pseudoacaciaL.) seeds observed by dedicated micro- magneticresonance imaging.Journal of Plant Research Springer: Online First DOI: 10.1007/s10265-016-0823-2 Koizumi M. & Kano H. (2015) Tracking manganese ion uptake and transport by the root system of broad bean plants by micro- magneticresonance imaging. American Journal of Biology and Life Sciences 3(4), 102-107. Kano H. & Koizumi M. (2014) Seasonal changes in the dynamic state of water for excised cherry branches (Prunus lannesiana) observed using dedicated micro-magnetic resonance imaging. Plant 2(6), 60-67. Kano H. & Koizumi M. (2014) Dynamic state of water in excised Ligustrum lucidum branches observed by dedicated micro-magnetic resonanceimaging. Plant 2(3), 33-40. Koizumi M. & Kano H. (2014) Lens: Water channel for dry broad bean seeds at germination observed by micro-magnetic resonance imaging. American Journal of Biology and Life Sciences 2(2), 37-40. Koizumi M. & Kano H. (2014) Water entry in dry soybeans at imbibition observed by dedicated micro-magnetic resonance imaging. AmericanJournal of Biology and Life Sciences 2(1), 6-11. ¬òü, ëìLü (2012) iv¥Î̬^MRIÆ~è÷. HiHÆ 55(12), 63-75. Haishi T., Koizumi H., Arai T., Koizumi M. & Kano H. (2011) Rapid detection of infestation of apple fruits by the peach fruit moth,Carposina sasakiiMatsumura, larvae using a 0.2-T dedicated magnetic resonance imaging apparatus. Applied Magnetic Resonance (online first) Koizumi M., Ihara F., Yaginuma K., KanoH. & Haishi T. (2010) Observation of the peach fruit moth, Carolina sasakii, larvae in young apple fruit by dedicated micro-magnetic resonance imaging. Journal of Insect Science 10:145, available online: DOI:http://dx.doi.org/10.1673/031.010. 14105 qtqV, ¬ò, Väü¿, ¬òü, ëìLü (2009) 0.2T¬^¥C¤ÂC[WOu(MRI)ÉæéSÊÀɨ¯éVNCKH üQÌϪ. ú{¶Ôwï 59, 249-257. ¬òü, ࡬O, ëìLü, qtqV (2009) Hi¤p¬^MRIÉæéL EÌÉaÔ²C[W. ú{HiÈwHwï 56, 146-154. y~n, qtqV, ä´jY, Väü¿, öÀF, ¬òü, ëìLü (2009) 0.2TRpNgMRIÆS. HiHÆ 52(16), 66-76. ä´jY, öÀF, ÎcMº, ¬òü (2008 ) ¬^¥C¤ÂC[WOu(MRI)ÉæéScÊÉHüµ½VNCKcÌo. ú{p®¨©wï 52, 123-128. Koizumi M., Kikuchi K., Isobe S., Ishida N., Naito S.& Kano H. (2008) Role of seed coat in imbibing soybean seeds observed by micro-magnetic resonance imaging. Annals of Botany 102, 343-352. Koizumi M., Naito S., Ishida N., Haishi T. & Kano H. (2008) A dedicated MRI for food science and agriculture. Food Science and Technology Research 14, 74-82. ¬òü, Ü\½êY, ëìLü, qtqV ( 2008) RpNgMRIÉæéâHiÌðßö -âØ÷Æâ÷-. HiHÆ51(24), 62-74. ¬òü, ࡬O, ÎcMº, qtqV, ëìLü (2008) RpNgMRIÆ ªÌÈ¢Hi -pÆÙqÞ-. HiHÆ 54(4),39-49. ¬òü, Ü\½êY, ࡬O, ÎcMº, enè, ëìLü (2007) å¤Ìz ɨ¯é éâè(1) ·úÛ¶å¤Ìàe¨Ro, z s ÇyÑcsÇÌð. ú{ø¢¦ï 102(7), 533-546. ¬òü, Ü\½êY, ࡬O, ÎcMº, enè, ëìLü (2007) å¤Ìz ɨ¯é éâè(2) ·úÛ¶å¤Ìàe¨Ro, z sÇyÑcsÇÌð. ú{ø¢¦ï 102(8),594-603. Koizumi M., Naito S., Haishi T., Utsuzawa S., Ishida N. & Kano H. (2006) Thawing of frozen vegetables observed by a small dedicated MRI for food research. Magnetic Resonance Imaging 24, 1111-1119. Kikuchi K., Koizumi M., Ishida N. & Kano H. (2006) Water uptake by dry beans observed by micro-magnetic resonance imaging. Annals of Botany 98,545-553. ¬òü, ëìLü, ࡬O, ÎcMº, chê (2006) ÊÀÌ۶ƥC¤Âæ@. ú{HiÈwHwï 53, 237-247. ¬òü, ࡬O, ëìLü, ÎcMº, qtqV (2006) RpNgMRIÆ[¤. HiHÆ 49(8),57-71. Naito S., Fukami S., Mizokami Y., Hirose R., KawashimaK., Takano H., Ishida N., Koizumi M. & Kano H. (2005) The effect of gelatinized starch on baking bread. Food Science and Technology Research 11, 194-201. ¬òü, ëìLü, ࡬O, ÎcMº, qtqV (2005) RpNgMRIÉæéâHiÌðßö -ìØ-. HiHÆ 48(22), 56-72. Naito S., Fukami S., Mizokami Y., Ishida N., Takano H.,Koizumi M. & Kano H. (2004) Effect of freeze-thaw cycles on the gluten fibrils and crumb grain structures on breads made from frozen doughs. Cereal Chemistry 81, 80-86. Ishida N., Naito S. & Kano H. (2004) Loss of moisture from harvested rice seeds on MRI. Magnetic Resonance Imaging 22, 871-875. ࡬O, [CVñ, aã×V, ëìLü, ÎcMº, ìK (2004) pÌCAEðx¦é÷×OeÔÌSEMÉæéÏ@. HiHÆ47 (4). Naito S., Ishida N., Takano H., Koizumi M. & Kano H. (2003) Routine evaluation of the grain structures of baked breads by MRI. Food Science and Technology Research 9(2),155-161. Takano H., Naito S., Ishida N., Koizumi M. & KanoH. (2002) Fermentation process and grain structure of baked breads from frozen dough using freeze-tolerant yeasts. Journal of Food Science 67(7), 2725-2733. Takano H., Ishida N., Koizumi M. & Kano H. (2002) Imaging of the fermentation process of bread dough and the grain structure of baked breads Ishida N., Takano H., Naito S., Isobe S., Uemura K.,Haishi T., Kose K., Koizumi M. & Kano H. (2001) Architecture of baked breads depicted by a Ishida N., Isobe S., Ogawa H., Koizumi M., Kano H. &Hazlewood C.F. (2001) Ontogenetic changes of water states and structural organization in Koizumi M., Ishida N. & Kano H. (2000) Postharvest fruits and MRI.Current Topics in Plant Biology 2, 1-20.
Water is the most abundant compound in living systems, and can be accounts for more than 85% of the fresh weight of plant tissues. The water content is closely related to cell activity as it is the primary matrix for metabolic reactions. Cell-associated water is necessary for transport of substances and O2to reaction sites, and for the removal of CO2and products from reaction sites. Moreover, dispersal of heat generated by metabolism is also mediated by water movement. Thus movement of cell-associated water controls the metabolic rate. However, since heat generated by metabolism accelerate water motion, metabolic activity affects the water transport rate through a feed-back mechanism. Cell-associated water moves within an area surrounded by cell membranes and interacts with cell-constituents, and cell-organisation. Macro-molecules in cells regulate the movement of water while functional actions of cell structures promote it. Hence, all physiological events are integrated on the physical state of cell- associated water. Dr. Hazlewood, a prominent researcher of water in living systems, told us that the study of life is watching the gDance of Water Moleculesh, which he at a young age, heard from Dr. Szent-GyÖrgyi. Since the properties of solution in tissues are rarely maintained when the structures are disrupted for analysis, Since all cellular events relate to the physical states of cell-associated water, we can map the fluctuating This is the case in plants. The mobility of water molecules in the leaves of living plants is regulated by In the similar way, our researches have been focused on finding interrelation between the physical states of cell- References
First, we will state about lightly equipped MRI apparatuses. The small size and the orientation for personal use are trends in modern science and technology similar to notebook computers or mobile phone. Easy operation and low- maintenance are other trends in modern society. In this context, we devised small dedicated MRI apparatuses. We hope that the devices are useful for agricultural research and plant science, and also exploring new applications of MRI in many research fields. Our works of MRI were initiated at 1987 by using an imaging attachment for a high resolution NMR spectrometer consisting of a superconducting magnet operating at 270 MHz for proton (devised by Mr. Ogawa of JEOL). We were intending to apply NMR and MRI for agricultural technology and plant science. In the progression of the research, we had a chance to read a paper describing a small dedicated MRI using 0.1-T resistive magnets by Constantinesco et al. (1997; Strasbourg, France), who are now active for developing dedicated MRI apparatuses with very low-field magnets for molecular imaging of small animals. The paper introduced us to the world of small MRI. 1. 1.0-T MRI apparatus Research of dedicated MRI apparatuses started at 2003 in the project of Ministry of Agriculture, Forestry and Fisheries for their support in constructing a small MRI through the Technological Development Program for gMaking agribusiness in the form of utilizing concentrated know-how from private sectorh. A small MRI apparatus was constructed based on the MRI system devised by Haishi et al. (2001) (MRTechnology, Tsukuba), which was a small proton MRI spectrometer. A permanent magnet of 1.0-T field strength made of Nd-Fe-B magnetic metals (NEOMAX Engineering Co., Ltd., Gunma) was used, and solenoid coil detector and gradient circuits were equipped. The concept of the device was not mobile, compact or specialized apparatus but one which can be used in a clean, cosy and casual space just by the desk, such as personal computers. The followings were introduced to overcome the defects associated with common small MRI apparatuses and to make the apparatus usable for various materials employed in food and agricultural products. The magnet used was stronger than similar small MRI system using a 0.1-T resistive magnet devised by Dr. Constantinesco above mentioned. A stronger magnetic field was advantageous for detecting weak signals and for obtaining good quality images with adequate spatial resolution. For the current development of the small MRI, NMR lock system was employed and besides NEOMAX Co., Ltd. provided newly devised temperature stabilizer for suppressing drifts in the magnetic field strength of the permanent magnet due to fluctuations in the ambient temperature. Another point was that the second order shim apparatus was equipped, although, ordinarily, the offset current supplied for the gradient circuits in the detector could be used as an effective shim for minimizing inhomogeneity in the magnetic field. Such improvements in accessories for imaging enabled us to configure small, light-weight and easily operable MRI apparatus.
|
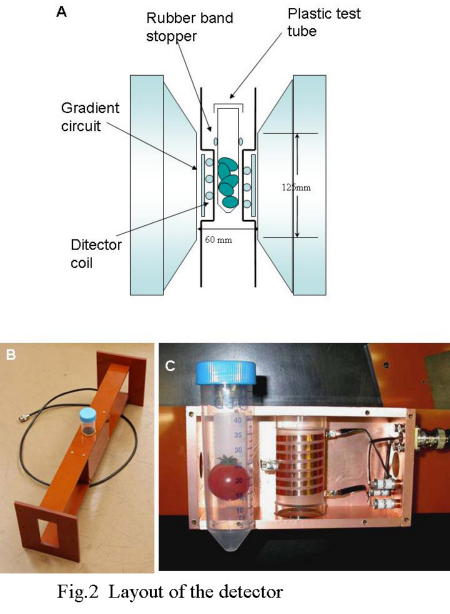
Figure 2 shows the layout around the magnet (A) and a detector (B) with a solenoid coil of 30 mm in inner diameter (C) and with a sample holder of disposable plastic test tube.The temperature of the magnet is usually kept at 28, 3 degrees higher than the room temperature.Therefore, the temperature of the measurement cell is maintained at the same temperature. The system depicts the inside organization of agricultural crops and food materials of less size than 30-mm cubic (gradient magnetic field strengths; Gx=40 mT/M; Gy=35 mT/m; and Gz=52 mT/m) (Koizumi et al., 2006). In addition, a detector with 20-mm solenoid coil was made. |
 |
| Figure 3 is the images of a small onion before (top; C) and after (bottom; F) shooting measured by using the 30-mm probe. A and D areT1-value images calculated based on series of several T1-weighted 2D images, and B and E are MIP images from 3D morphological image data. T1-value images and MIP images were constructed using the facility ofImageJ program [public domain Java image processing program (ver. 1.33); available on the Internet at http://rsb.info.nih.gov/ij/]. TheT1-value images indicate that the shoot was small, scale leaves were tight, vascular bundles were thin and T1-values of the scale leaves were high before shooting, while the shoot grew, scale leaves shrunk, vascular bundles became bold and T1-values in parts of scale leaves declined after shooting. Such physiological changes in the bulb were well drawn by MIP images; signals of small shoot and roots were weak before shooting while they were intensified, in consequence, the architecture of vasculature were clearly visualized after shooting. |
 |
Figure 4 shows the micrographs of vasculature of a cucumber fruit (top; A and B), and aT1-weighted (bottom; C) and T2-weighted (bottom; D) images. There are several layers of phloem cells in both inner and outer sides of large apoplastic xylem vessels on the optical micrographs. The morphology of vasculature corresponds to the facts thatT1-weighted image intensified xylem vessels at the center of thevasculature, whileT2-weighted images showed phloem cellsaligned in dual rows (Koizumi et al., 2009). Water mobilityinphloem cells was high and that in xylem vessels was low.Physical state of cell-associated water discriminatedphysiologically differentiated cells in the vasculature. |
 |
Figure 5 presents the slice images (top) of packed silica gels (A type), mean pore size of which is 24ð with various watercontents. Measurements of the images were carried out bythe 3D gradient-echo method using the 20-mm probe.Signals were detected if the water content exceeded 15%ofdry weight by single transient acquisition. Intensity of FIDsignals of wet gels showed almost linear relation with watercontent. The apparatus of low magnetic field can detectsignals from the materials containing small amount ofwater,since in the low magnetic fields,T2decay of signal isslowerthan in the high magnetic fields (Koizumi et al., 2009).Thismay have positive effect in obtaining intense signals by 1.0-T small MRI. The 1.0-T small MRI apparatus is stable and suitable for the measurement of physical state of water in plant cells. Hence, it may be a good tool for watching the dance, dynamic changes of water molecules in living systems. References Constantinesco A, Choquet P,Cauffet G, Fournier JM, Ravier S, Drillon JM, Aubert G. 1997. Low-field dedicated and desktop magnetic resonance imaging systems for agricultural and food applications. Magnetic Resonance in Chemistry35: S69-S75. Haishi T, Uematsu T, Matsuda Y,Kose K. 2001. Development of a 1.0 T microscope using a Nd-Fe-B permanent magnet. Magnetic Resonance Imaging 19: 875-880. Koizumi M, Naito S, Haishi T,Utsuzawa S, Ishida N, Kano H. 2006 Thawing of frozen vegetables observed by a small dedicated MRI for food research.Magnetic Resonance Imaging24: 1111-1119. Koizumi M, Naito S, Ishida N, Haishi T, Kano H. 2009. Examination of the tissue water in cucumber fruit by small dedicated magnetic resonance imaging with a 1-T permanent magnet.Nippon Shokuhiun Kagaku Kogaku Kaishi56: 146-154(in Japanese with English abstract). |
 |
Figure 1 is the apparatus equipped with a magnet of 50~50 cm2and 75 cm high (500 kg in weight), which has a 160-mmpole gap (Left). The resonating frequency is 8.9 MHz for proton. The magnet of Nd-Fe-B blocks (NEOMAX Engineering Co., Ltd., Gunma), was also specially designed forthe apparatus. The magnet is equipped with gradient coils which functions as the first-order SHIM (a system shimmingthe magnetic field), though the second order SHIMwasadditionally designed. The MRI spectrometer (MRTechnology, Inc., Tsukuba) is a new model, and is 60 cm square and 80 cm high (100 kg in weight) (Right) with a rack-mounted PC running the WindowsXP-SP3 operating system (Microsoft Japan,Tokyo).Theconsole display, mouse, and keyboard are placed on the spectrometer, making the apparatus compact enough to be set in a space of 2 m2. |
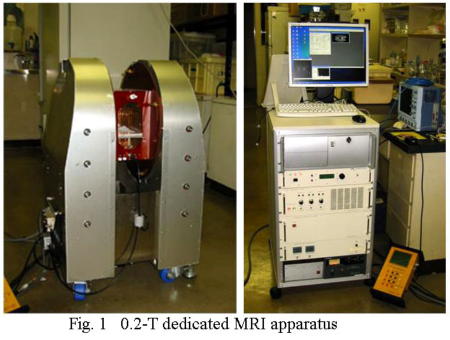 |
Figure 2 presents the layout of the magnet (A) and detectors(B|E). Poles of the magnet (b and c) are sustained by iron-yokes (d), which are joined by two iron bridges (f) atthebottom. Therefore, the direction of the magnetic fieldishorizontal (denoted as the Z-axis). The temperaturearoundthe whole magnetis maintained at 29 with acontroller toprevent any shift of resonating radio frequencyand tostabilise the signal. There is a wide gap (h; 160-mm)betweenthe poles exposed to ambient air, therefore, thetemperatureof the measurement cell is near roomtemperature. Four detectors are built. A 110-mm diameter solenoid coildetector (B) and a 165 mm~90 mm oval solenoid coil detector (C) are used for 3D measurements; these have specific housings to shield them from external radio-frequency energy. The FOV is 110 mm cubic and the maximum magnitudes of the gradient magnetic field are Gx=4.9 mT/m, Gy=8.4 mT/m, and Gz=8.4 mT/m. A short solenoid coil detector that is 94 mm in diameter and 35 mm in length which is composed of four turns (D), as well as a surface coil detector of four loops with 75 mm innerdiameter and 5 mm thickness (E) are prepared. These arespecially designed for improving sensitivity around the imaging slice by narrowing the diameter and shortening the length of the coils based on the results of Hoult and Richards (1976). These detectors are placed in a common oval housing and shielded from external radio-frequency energy. The former has a Q of 170 (at|3 dB), and the latter has a Q of 155 (at|3dB) when conductance is adjusted to50¶. |
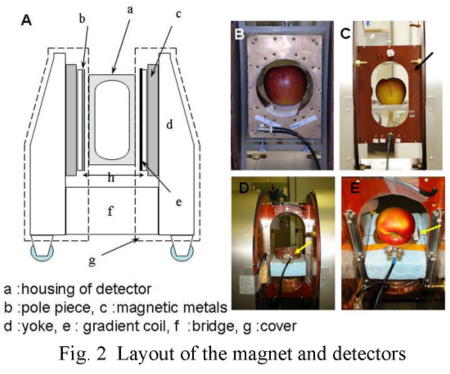 |
Figure 3 is the images of an apple fruit infested by peach fruit moth larvae measured by the 3D spin-echo method using the 110-mm probe (Haishi et al., 2009). The fruits size was approximately 100 mm in diameter (A). Spin-echo method provided clear images in contour and with many gradein gray scale although it took long measurement times (B). Amature larva just leaving the fruit was detected inlargelyinfested holes and accumulated excreta with strongsignalswere detected (C). |
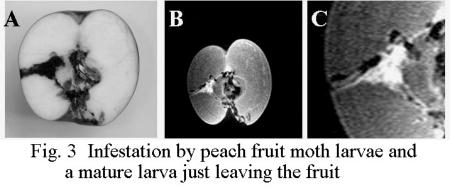 |
Figure 4 illustrates the freezing system for materials during measurements designed by Mr. Masaki (Akitsu Keisoku Ltd.,Tokyo) (A). Temperature of nitrogen gas was lowered by passing through a radiator chilled by solid carbon-dioxide in ablue box, then accurately controlled temperature in the regulation box attached below and sent to the measurement cell in the oval probe (B). Temperature of gas stream was lowered down to|50 at entrance into the cell. |
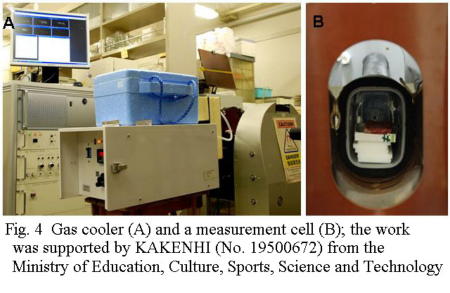 |
Figure 5 indicates the changes in images of a freezing mandarin orange exposed to thin stream of cold nitrogen gas.Measurements were carried out underT2-weighted conditionby the 2D spine-echo method and it took for 9 min a image.Juice vesicles inside fruits disappeared at the position wherecold gas stream was passing, in accordance with time. |
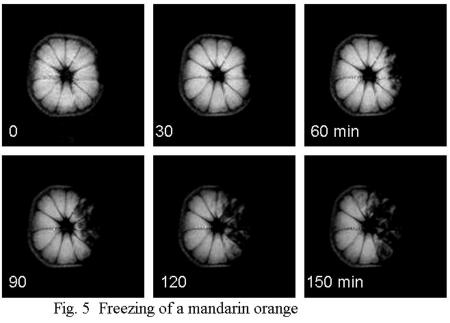 |
Figure 6 compares theT1-values of a Kinki or Kichiji fish of raw (A) and freeze-thawed (B) conditions. Since this fish is said to be tolerant to freezing, there seemed no obvious difference onT1images between the two conditions, however,discrepancies were detected on the distributions of T1values. The histograms of T1value showed skewed distribution at the longer ends. The averageT1value shifted longer side and the shape of histogram more skewed after freeze-thawing. The 0.2-T MRI apparatus has not been fully characterized, orthere are several subjects to be solved in stability, while, thedevice was confirmed to be rather sensitive in acquisitionofsignals and to provide clear morphological images formanyagricultural materials. There was a restriction of the load-bearing limit in weightin construction of the apparatus; therefore, magneticfieldstrengths had to belowered in trade with widening of air-gapof the magnet. Therefore, the orientation of the smalldedicated MRI apparatuses equipped with permanent magnets are not agree with the concept of micro-imaging apparatuses that high magnetic field is advantageous for obtaining intense signals from small voxels and thus can obtain good quality images. The limited sensitivity from low magnetic field is intended to overcome by highly stabilizing magnetic field to lower noise level where slowerT2-decay of signals in the low magnetic fields (Donker et al., 1996; Koizumi et al., 2009) may be a help for attaining high signal to noise ratio. In this context, a main subject is minimizing the change in the magnetic field strength duetothe fluctuation of room temperature, for which new approach have to be considered. |
 |
 |